The majority of people today are familiar with Tropical Cyclones, which often cause severe damage to nature and humanity in certain regions of our globe.
Almost always however, people are not aware of basic meteorology fundamentals, such as how and why Tropical Cyclones are more powerful and severe than normal Storms.
Therefore, they resist conforming to societal standards and challenging the might of nature.
Due to the fact that storms and tropical cyclones in general tent to become more intense as a result of climate change, it is vital that we learn useful knowledge about them.
First, Tropical Cyclone is an umbrella word encompassing cyclones that originate in tropical oceans. At the North Atlantic and Eastern North Pacific Ocean, for example, the National Hurricane Center (NHC) defines a Tropical Cyclone as an area of low pressure with a warm core at its center that develops over Tropical or Sub-Tropical waters and is depicted on a surface chart by a number of closed circular isobars, with associated steep pressure gradients.
Tropical Cyclones are often classified according to the intensity of their strongest related winds:
(1) Tropical Depression (TD) – wind speed at the surface is less than 33 knots (7bf)
(2) Moderate Tropical Storm (TS) – wind speed at the surface ranges between 34 and 47 knots (8-9bf)
(3) Severe Tropical Storm (STS) – surface wind speeds between 48 and 63 knots (10-11bf)
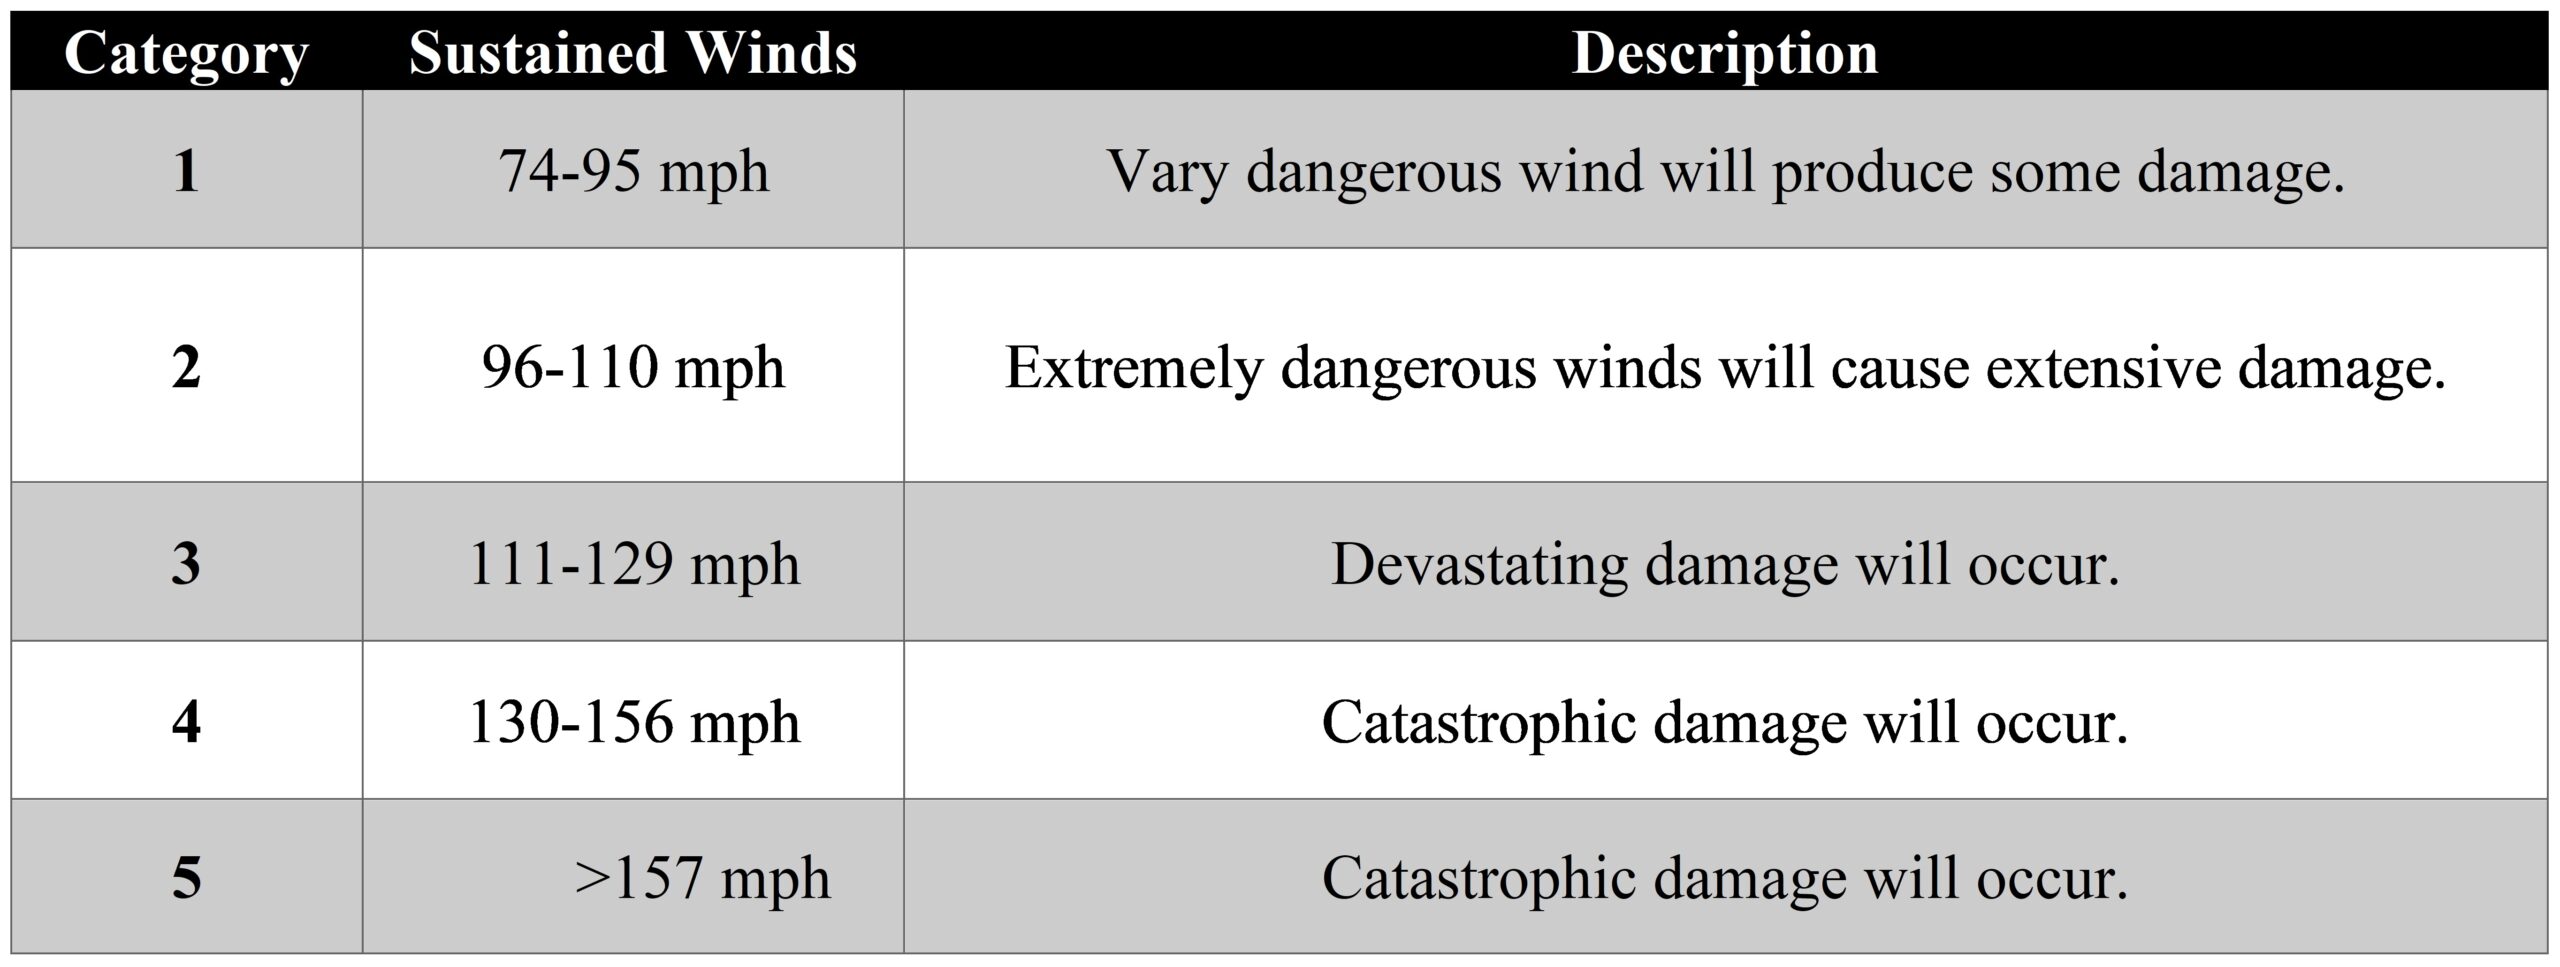
(4) Hurricane (Hu) – wind speed at the surface of 64 knots or higher (>12bf)
(5) Major Hurricane (MHu) – wind speed at the surface reaches 96 knots (>12bf)
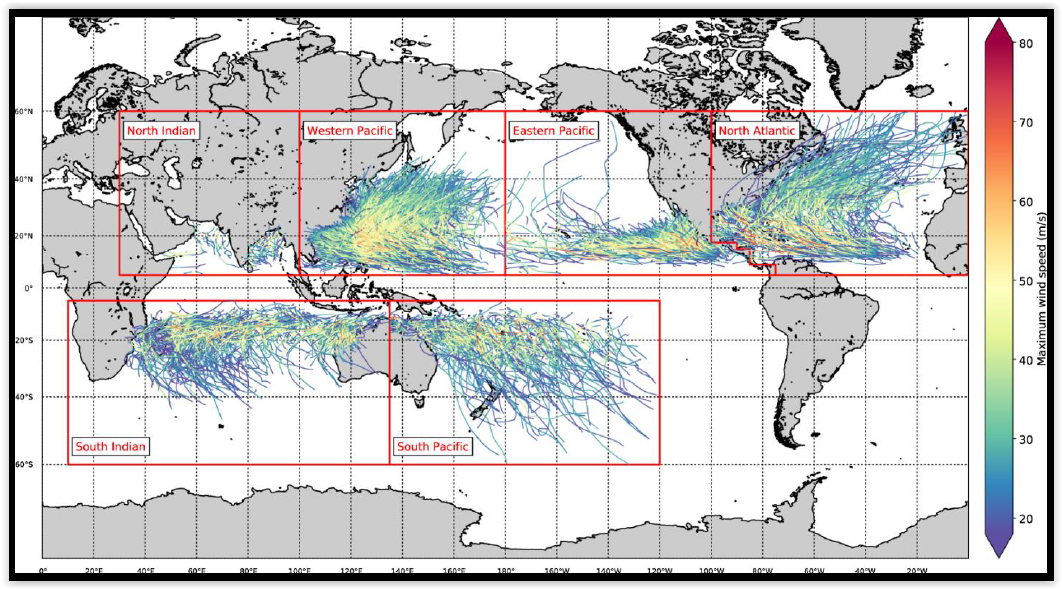
During particular seasons, tropical cyclones develop and affect virtually exclusively six separate regions. In particular, you may view the occurrence locations, terminology and season listed below:
(1) North Atlantic Ocean (including Caribbean Sea & Gulf of Mexico) – Hurricane Season: May through November
(2) Eastern North Pacific Ocean – Hurricane Season: May through November
(3) Western North Pacific Ocean – Typhoon Season: April through December
(4) North Indian Ocean (including Bay of Bengal & Arabian Sea) – Cyclone Season: April through December
(5) Western South & Eastern South Indian Ocean – Cyclone Season: November through April
(6) Western South Pacific Ocean – Cyclone Season: November through April
Tropical Cyclones develop from preexisting disturbances, which are often convective cloud clusters accompanied by a low-level cyclonic vorticity maximum, such as a tropical wave. Due to the pressure gradient effect, air will flow inward into the low-pressure region where low-level vorticity is present. As a result of the Coriolis force, incoming air is deflected to the right in Northern Hemisphere (left in Southern) and a counterclockwise circulation is produced.
Near the area of lowest pressure, the inflow of air causes low-level convergence, which in turn causes rising motion and deep convection. Tropical Cyclone is essentially a heat engine, with the underlying water serving as its heat supply. According to research, the sea surface temperature must be at least 27 degrees Celsius. At this temperature saturated air contains a great deal of water vapor, and when the air ascends, adiabatic cooling induces condensation with the release of latent heat of vaporization, which is the energy source for the development and maintenance of tropical cyclones.
In addition, the vertical wind shear, which refers to the variation in wind speed with height, must be sufficiently low, less than 15 to 20 knots from the surface to the high troposphere.
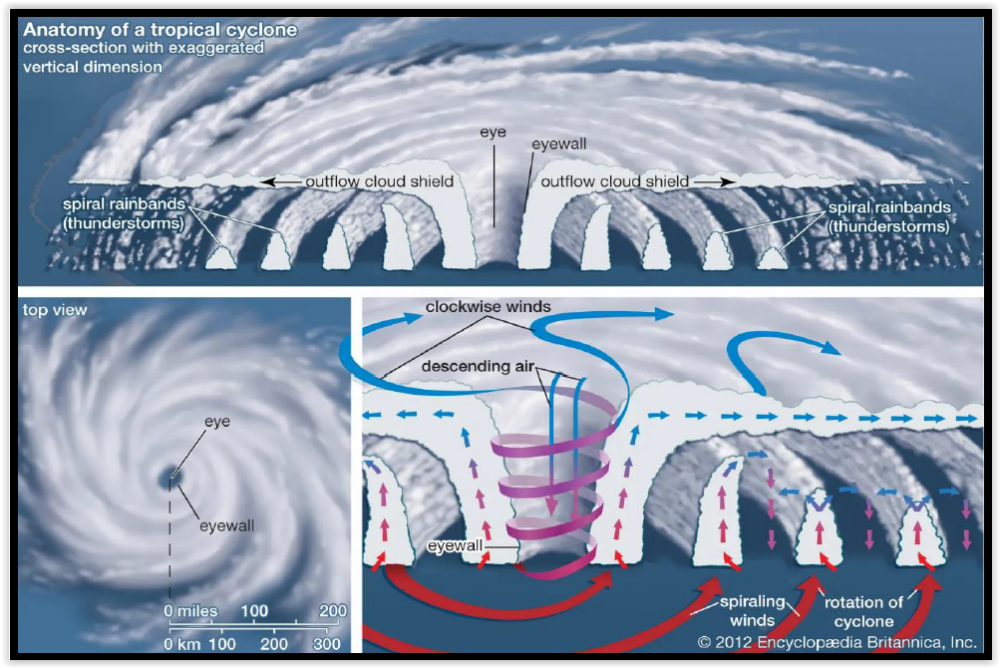
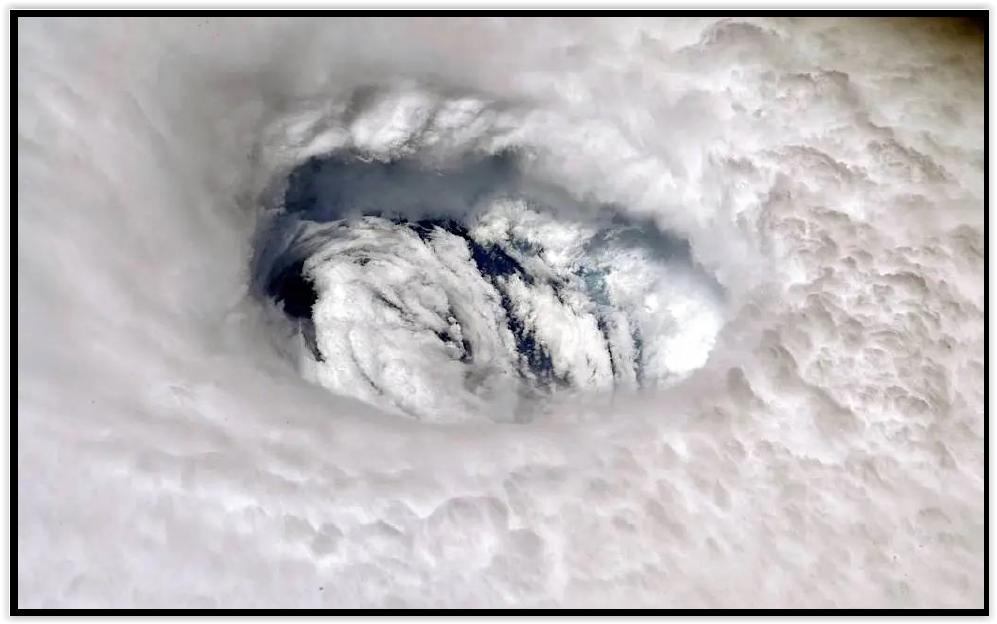
A Tropical Cyclone has an average diameter of around 700km a core pressure of 960 hPa at mean sea level and very steep pressure gradients. Nevertheless, its diameter and pressure levels change during its lifetime. The center of the system is dominated by a 55-kilometer-diameter eye, or vortex, in which calm conditions predominate. However, winds of Beaufort Force 12 or higher are present directly outside of this region. The eye is encircled by the eye wall, which is a ring of Cumulonimbus clouds, and has normally cloudless sky. The perimeter is characterized by dense cloud bands from which torrential rains pour, derived by regions with little rain or no precipitation.
It is crucial to note that tropical cyclones typically take several days or a week to develop from a chaotic collection of thunderstorms to hurricane strength, however this change has occurred in less than a day on rare occasions. If environmental circumstances are favorable, tropical cyclones will assemble, migrate, and intensify. When they encounter a land, they lose their vigor and become weaken (doing Landfall).
The sophistication of guidance products supplied by operational prediction centers across the world and the accuracy with which Tropical Cyclone tracks may be forecasted have vastly improved over the past several decades. For instance, in 1970s, the average 72-hour Atlantic basin tropical storm or hurricane prediction error was greater than 350 nautical miles, but in the present day, the average error is less than 100 nautical miles. Several Regional Specialized Meteorological Centers (RSMCs) are authorized by the World Meteorological Organization (WMO) to provide tropical storm predictions and alerts.
When a tropical storm is active, the National Hurricane Center
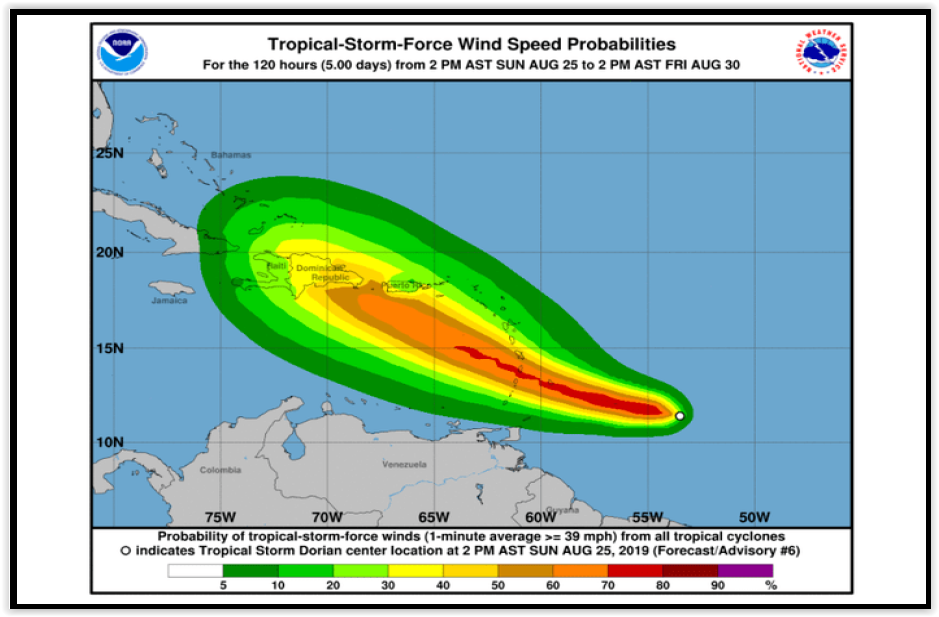
(NHC – https://www.nhc.noaa.gov/ ) produces tropical cyclone warning packages that include many official text and graphical products. Every six hours at 0300, 0900, 1500 and 2100 UTC, this suite of advisory products is published. Public Advisory, Forecast/Advisory, Tropical Cyclone Discussion and Wind Speed Probability are the principal text products.
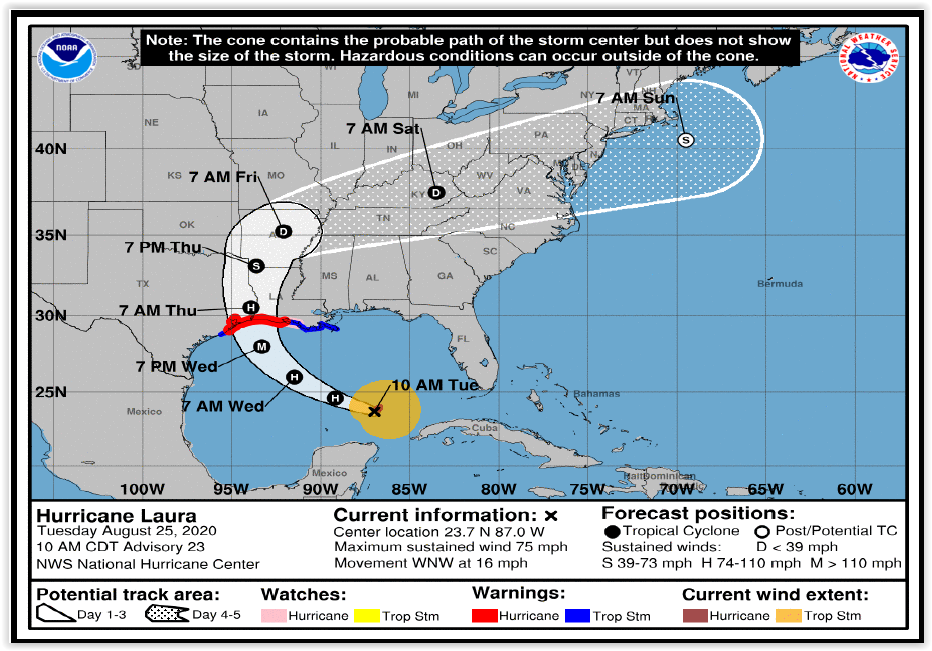
In addition, the Tropical Cyclone Track Forecast Cone and Watch/Warning Graphic depicts the most recent NHC track forecast of a tropical cyclone’s center, as well as an approximation of coastal areas under a hurricane warning (red), hurricane watch (pink), tropical storm warning (blue) and tropical storm watch (green) (yellow). The orange circle indicates the present location the tropical cyclone’s center. The cone indicates the track of a tropical cyclone’s core and is constructed by enclosing the region blown out by a series of rings along the predicted trajectory.
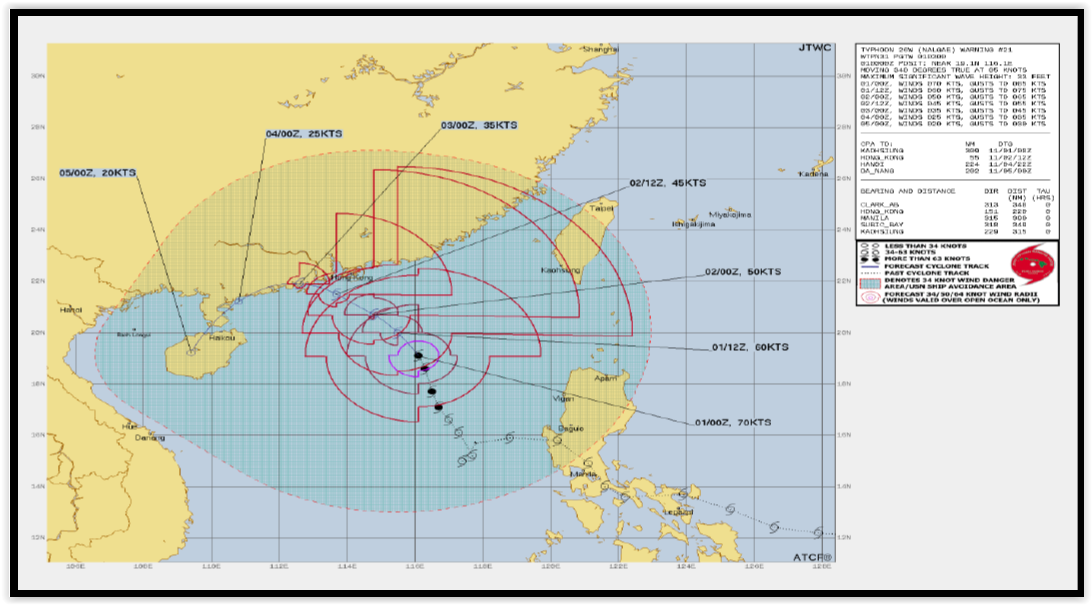
The Tropical Cyclone Danger Graphic is a product of the National Hurricane Center that is based on the “Mariner’s 1-2-3 rule”. The images illustrate the danger zone associated with tropical storms from the equator to 60°N between 0° and 100°W, including the Pacific East of 100°W, and from the equator to 40°N between 80°W and 175°W, including the Gulf of Mexico and Western Caribbean.
Add 100, 200 and 300 nautical miles to the tropical storm force 34 knots at the 24, 48, and 72-hour forecast locations, respectively, to establish the danger zone.
Given the improvements in forecasting and the increasing availability of receiving these forecasts at sea , the most effective way to avoid an encounter with a tropical cyclone is to monitor the forecast products from the appropriate RSMC or TCWC and take early action, which includes determining the tropical cyclone’s location and direction of travel relative to the vessel and maneuvering the vessel accordingly. To retain situational awareness and safety in the midst of severe storms, a mariner must be skilled at recognizing and categorizing environmental changes. Typically, the first observable evidence of a tropical cyclone’s existence is the appearance of extremely lengthy swells.
If the ship is within the cyclonic circulation, the first step is to calculate the ship’s position relative to the storm center. While the vessel may still make substantial progress through the water, a path should be chosen to take it as far from the center as feasible. Assuming the vessel can travel faster than the storm, it is reasonably easy to outrun the storm if there is sufficient sea room. But when the storm is more intense, the answer is not as straightforward.
Stratos Avgerinos Meteorologist – Weather Routing Analyst – Oceanroute S.A.